Are you SHOKed?
Or how you can detect knowledge leakage in your organization

Have you ever heard about a disease called Hydrocephalus?
Hydrocephalus is the buildup of fluid in the cavities (ventricles) deep within the brain
Source: Wikipedia
In medical history, there is one notable case: in July 2007 French 44 years old man was diagnosed with Hydrocephalus, with about 90% of his brain destroyed by liquid. And he was still able to live an almost healthy life.
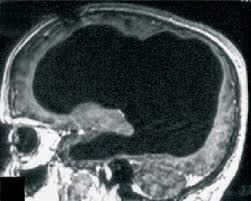
It is incredible how brain cells slowly took responsibility for destructed parts and kept almost all functions! Of course, the process was prolonged and happened for 30 years, but still — an excellent example of sustainability. It became possible because of efficient information exchange between brain cells.
But let's try to apply this example to organizational structure. What will happen if one of your organization's "cells" disappears? If you lose all the information it contains will also disappear. Will any other "cell" will be able to take the first one functions? And if 10% of cells? And according to 10x thinking behavior, let's make a high bet - will your organization survive if 90% of cells are lost? Even if we will admit that we will replace them with new ones.
Each organization is a complex and multilevel organism — many people, teams, departments, and many dependencies. It is an excellent example of a live social network. And as any social network, it requires the flow of information to stay alive.
There are different levels of information - global, department-level, local, and even personal. I define Organization Knowledge as a summary of all this information spread across the company. And as with any flow, information spread can have bottlenecks and leakages, leading to various troubles.
For leaders, one critical task is to sustain the organization's structure. As engineers, we can compare it to a very complex mechanism. Let's take a rocket, for example. Rocket is working in a very unfriendly environment, and there are few possibilities to fix something on the run. That's why in such situations, engineers make duplicated schemas and nodes. If one will unexpectedly break - there is always a hot replacement.
Unfortunately, too often, I met situations when organizations had a lot of processes and knowledge in the hands of a single person or a small team. Get to know SHOK (Single head of knowledge) - one of the management anti-patterns. More broadly, it is known as Bus Factor.
So, how can we fight this dysfunction?
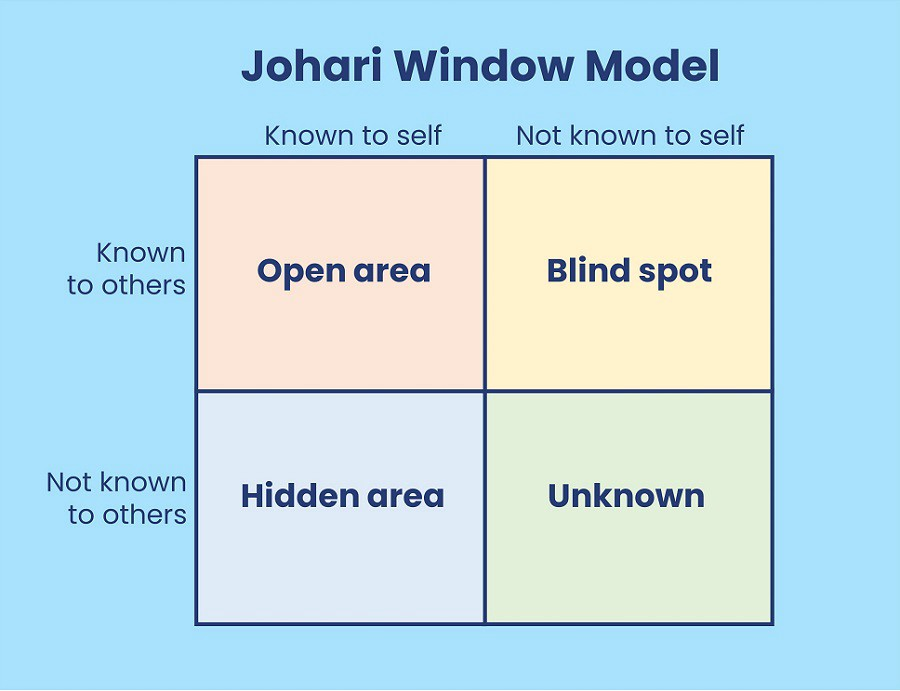
As always, we need to start with identification if the problem exists. I prefer the Johari Window model framework applied against all proper functions for all people in the company. Initially, this model was designed for better self-awareness and social representation, but it is also handy for knowledge spread analysis.
First, we need to identify the list of all critical functions in our business. It is quite a challenging but required task by itself. In fact, if you don't have such a list, you are already in trouble =) You will need to bring all your departments' heads together to build it as soon as possible.
Let's take the simplified example based on the Engineering department. Imagine you have agile methodology applied to the development lifecycle. We will skip planning and estimation of the tasks and will take only implementation and delivery:
Task implementation (coding part)
Quality Control
User Acceptance testing
Backup
Deploy
Once again - this is an oversimplified model, but I hope enough for an example.
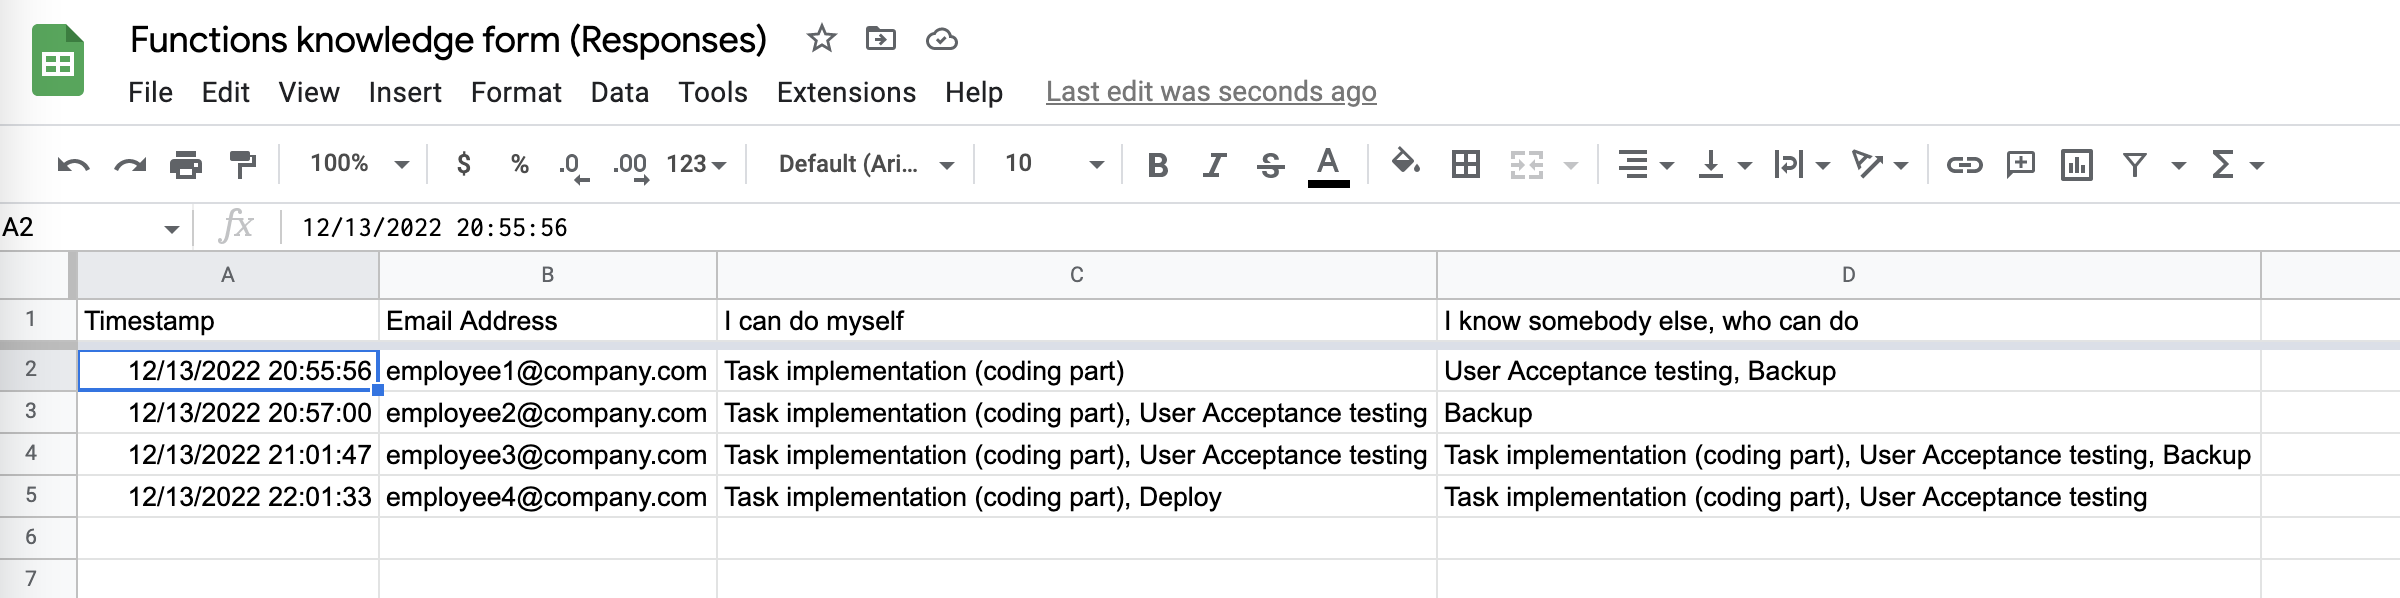
So, we have the list. Now we can make a simple form to collect information across the company. There are many tools for collecting data, but for this example, I used Google Forms and Google Spreadsheet.
The form is relatively simple due to the oversimplification of our example. In real life, it will be much longer.
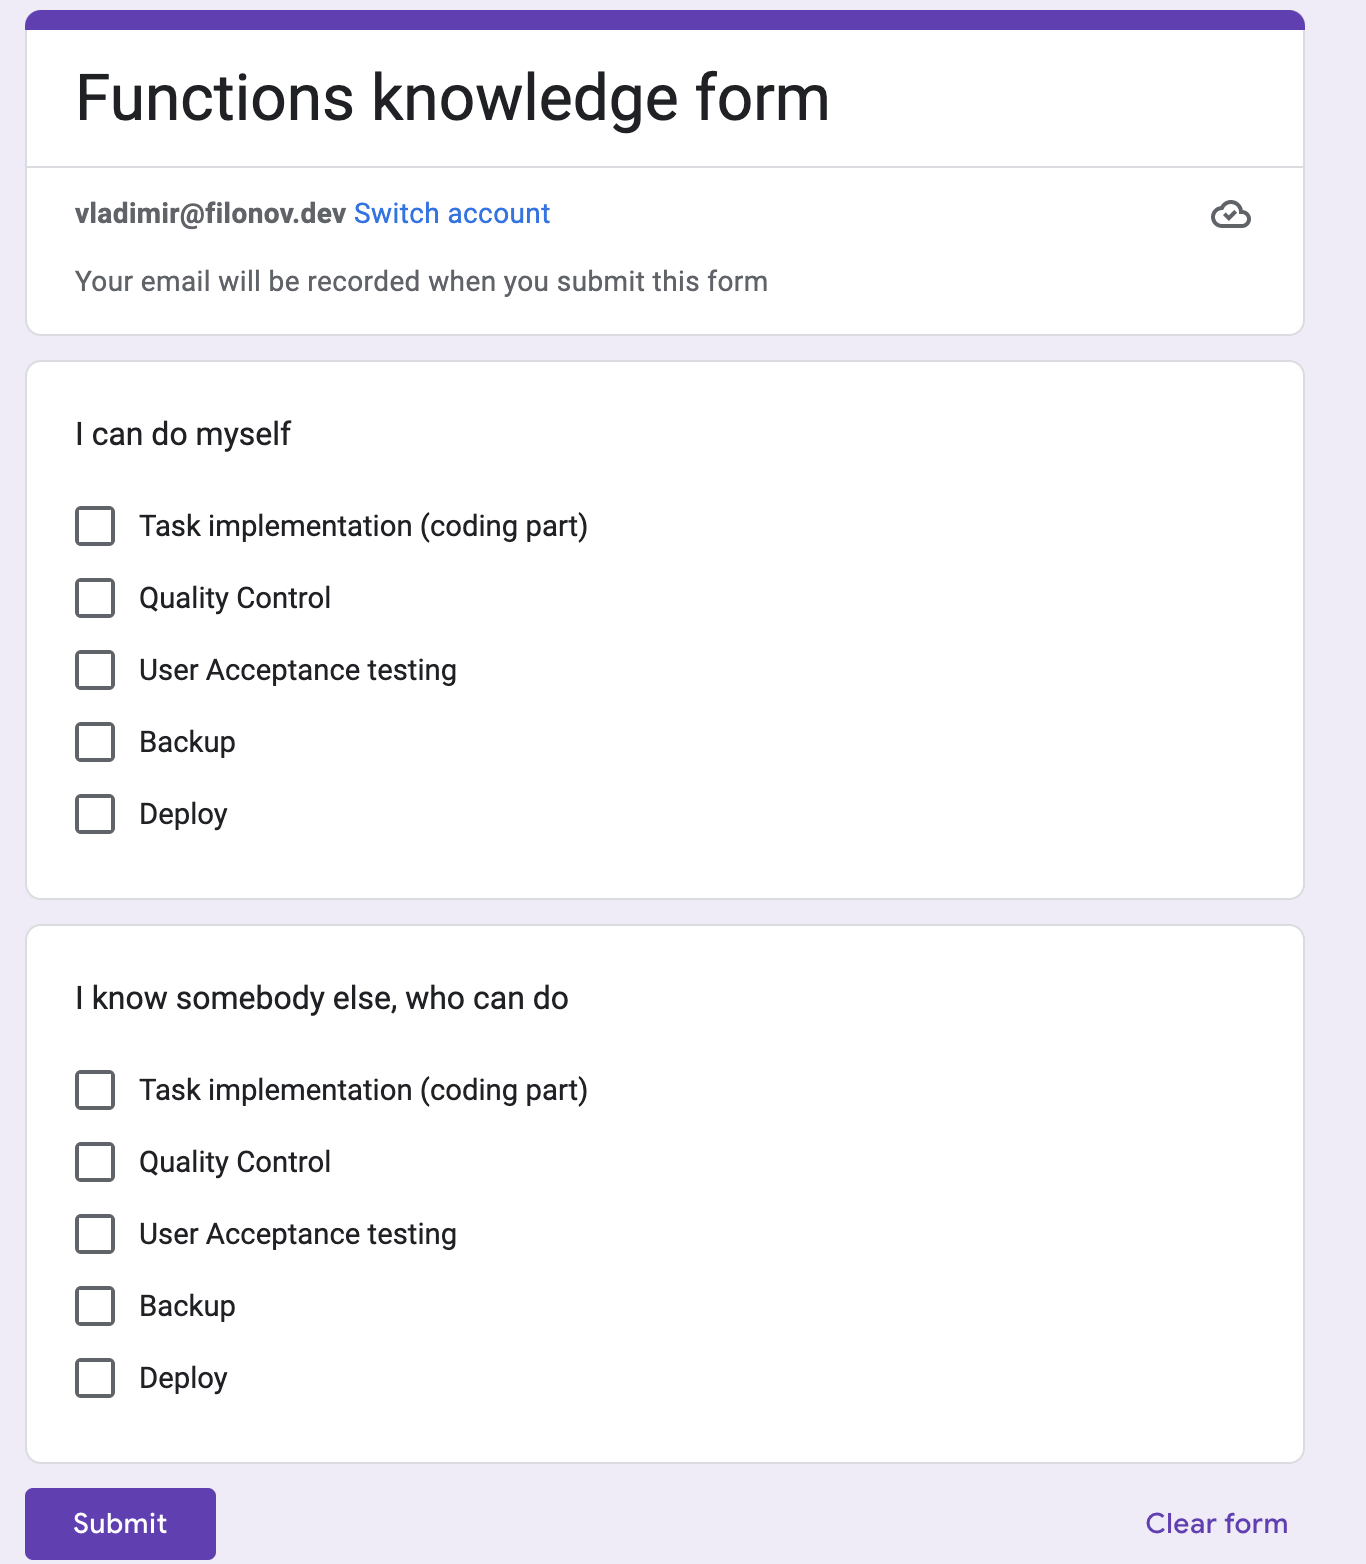
As you can see, there are two sections: "Can do" and "I know a guy." And no, "I know a guy… who knows a guy… who knows another guy" (c) does not work. Only direct relations =)
An outcome spreadsheet will look like this:
Honestly, I'm not a spreadsheet pro, so my methods are probably not brilliant. But they work for me =) BTW. I will be glad if you will send me a more elegant solution. So.
My goal is to create a Bubble Chart to visualize the high-level state of knowledge in the company.
On another sheet, I'm creating a new table with a list of all functions and columns representing Known/Unknown to self, Known/Unknown to others, and the bubble size.
| Function | Self | Others | Size |
| Task implementation (coding part) | |||
| Quality Control | |||
| User Acceptance testing | |||
| Backup | |||
| Deploy |
For self & Others, I'm using such formulas:
# Self
=IF(COUNTIF('Form Responses 1'!$C:$C, "*" & A2 & "*"), 1.5, 0.5) + RAND()/3*IF(RAND()>0.5, -1, 1)

#Others
=IF(COUNTIF('Form Responses 1'!$D:$D, "*" & A2 & "*"), 1.5, 0.5) + RAND()/3*IF(RAND()>0.5, -1, 1)
Awful… But work in most cases =)
Since Google Forms stores multiple checkboxes answers to a single cell as a string separated with a comma, I'm just using a substring search to identify if any responder selected an option.
Why 1.5 and 0.5? I'm creating Bubble Chart with an x/y axis from 0 to 2, so 0.5 and 1.5 are just the centers of squares I receive. And to not let all bubbles overlay, I'm adding a random shift.
The formula to calculate bubble size is almost similar. The more people select this option - the bigger bubble we need.
=COUNTIF('Form Responses 1'!$C:$D, "*" & A2 & "*")
As an outcome, we will have a chart like this:
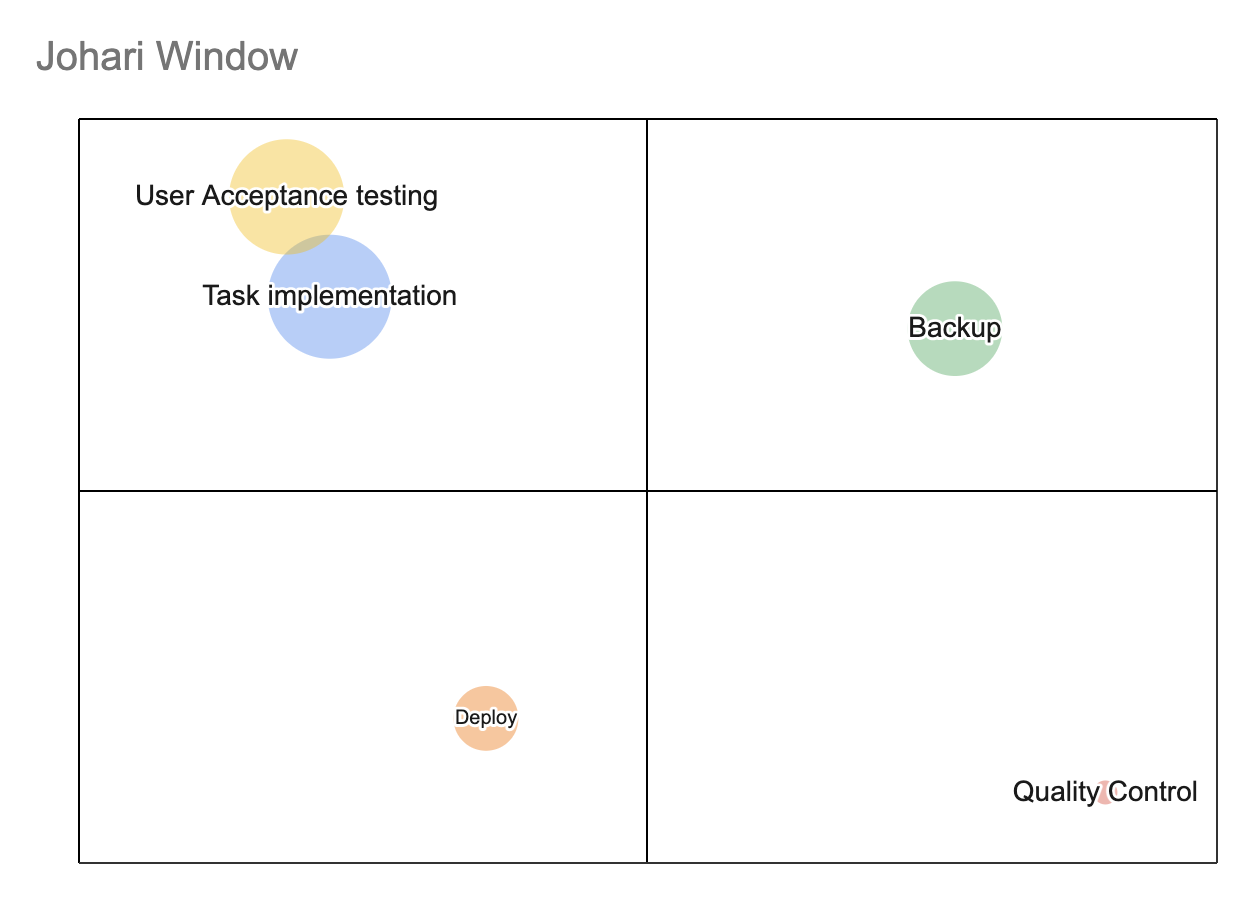
The Upper left square is the "Open area." It means that at least some people marked both - they can do this function by themselves and know somebody who can do it also. Functions in the area are safe, and ideally, all bubbles should be here. The more people mention this function, the more giant bubble we have.
The lower left square is the "Hidden area." Some people know how to do this, but nobody knows who else can. But even if the bubble is massive, there is a communication issue since nobody is sure that this function can be done by somebody else.
Upper right - “Blindspot”. Everybody thinks that somebody else can do this, but nobody really mentioned that can — a hazardous situation.
And the last one - "Unknown." Oops. Nobody can, and nobody can mention somebody. Have something in this area? Time to panic - something is going very wrong =)
Of course, this is not the ideal representation of reality, but it gives you an overall view of the situation. It can help you to identify weaknesses and knowledge loss in your processes. The more granular questionaries you will have, the better results you will obtain. This method works better if you collect function and data on a team level.
As I mentioned, identification of the problem is the very first step. And at this point, we have a general overview and can initiate the process of handling knowledge gaps and weaknesses. How to do this we will talk about in the following articles.
Start to collect data, and stay tuned!