A few words about memory profiling in Python

Memory issues in applications are quite common. Luckily, in Python you have to work with memory directly only when writing CPython extensions, so you have to deal with such issues less often. Using frameworks also reduces the risks of causing memory leaks.
However, understanding how memory is allocated in an application is always helpful. Let's see what possibilities we have with a small Django project as an example.
So we have a simple data model:
class Department(models.Model):
    title = models.CharField(max_length=120)

class Course(models.Model):
    title = models.CharField(max_length=120)
    department = models.ForeignKey(Department, on_delete=models.CASCADE)
    description = models.TextField()

class Lesson(models.Model):
    title = models.CharField(max_length=120)
    datetime = models.DateTimeField()

    course = models.ForeignKey(Course, on_delete=models.CASCADE)
And a dozen views that return JSON. Let’s review how memory will be consumed.
First of all, we need to see the overall picture. Let’s take the memory-profiler package.
It has a handy decorator that allows us to view memory dynamics in any function. Let's check one of the views:
from memory_profiler import profile

@profile
def get_lessons(request):
   lessons = list(Lesson.objects.all())

   data = []
   for lesson in lessons:
       data.append({
           'title': lesson.title,
           'datetime': lesson.datetime.isoformat()
       })

   dump = json.dumps(data)
   return HttpResponse(dump, content_type="text/json")
By default, @profile outputs results directly into stdout. And it looks like this:
Line #    Mem usage    Increment   Line Contents
================================================
    29     59.7 MiB     59.7 MiB   @profile
    30                             def get_lessons(request):
    31     66.6 MiB      6.9 MiB       lessons = list(Lesson.objects.all())
    32
    33     66.6 MiB      0.0 MiB       data = []
    34     69.1 MiB      0.3 MiB       for lesson in lessons:
    35     69.1 MiB      0.3 MiB           data.append({
    36     69.1 MiB      0.2 MiB               'title': lesson.title,
    37     69.1 MiB      0.3 MiB               'datetime': lesson.datetime.isoformat()
    38                                     })
    39
    40     70.6 MiB      1.5 MiB       dump = json.dumps(data)
    41     71.3 MiB      0.7 MiB       return HttpResponse(dump, content_type="text/json")
Absolute values are not as important as Increment. Alas, it is not always descriptive. For example, filling a list with data dictionaries in a loop will give an increase of 2.5Mb, although the sum of the increments shows only 1.1Mb.
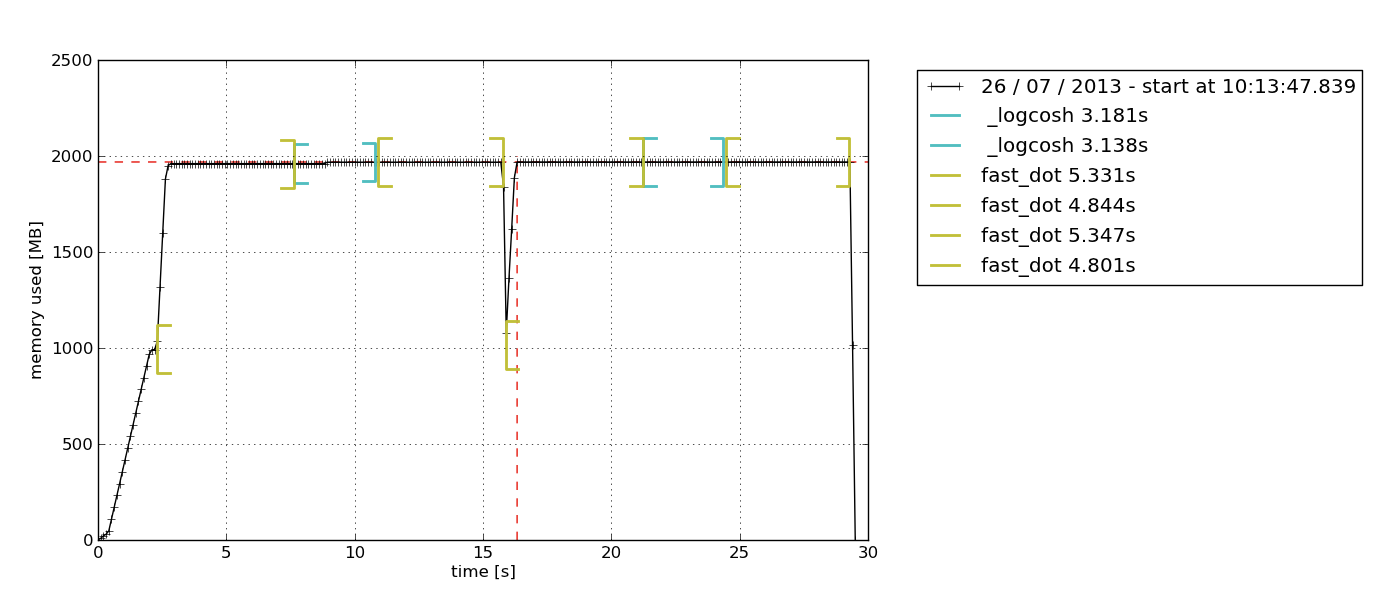
If we want to check for a memory leak, data within a single call is not enough. We need to collect some statistics. And for this memory-profiler has executable mprof. It collects data and then generates charts like this:
Unfortunately, memory-profiler does not show deep details, so here another library comes to the help - pympler.
It allows us to get statistics about different data types. Let's look at an example:
from memtest.models import Lesson
from pympler import tracker
tr = tracker.SummaryTracker()
lessons = list(Lesson.objects.all())
tr.print_diff()
Let's check what was created in memory when we received 10050 Lesson records from the database:
                                     types |   # objects |   total size
========================================== | =========== |
                               <class 'str |       20172 |      1.30 MB
                              <class 'dict |       20206 |      1.89 MB
                              <class 'list |        9977 |      1.00 MB
                               <class 'int |       21891 |    598.59 KB
  <class 'django.db.models.base.ModelState |       10050 |    549.61 KB
             <class 'memtest.models.Lesson |       10050 |    549.61 KB
                 <class 'datetime.datetime |       10050 |    471.09 KB
                              <class 'type |           9 |      9.68 KB
                              <class 'code |          41 |      5.97 KB
                           <class 'weakref |          25 |      1.95 KB
                       function (<lambda>) |           9 |      1.20 KB
                 <class 'method_descriptor |          12 |    864     B
                 <class 'getset_descriptor |          10 |    720     B
                         function (as_sql) |           5 |    680     B
                 <class 'collections.deque |           1 |    632     B
We have a lot of strings. But it's okay - web protocols are mostly text.
But we have even more dictionaries. And their number is directly proportional to the number of records that we get — each instance has __dict__ attribute. Also, we can see that for each Lesson instance there is also one django.db.models.base.ModelState (the class that stores the state of the instance) and datetime.datetime due to the presence of a DateTimeField in the model.
It is curious that if we get not only Lessons, but also related data using select_related, the picture of memory consumption will change:
tr = tracker.SummaryTracker()
lessons = list(Lesson.objects.select_related("course__department").all())
tr.print_diff()
                                              types |   # objects |   total size
=================================================== | =========== |
                                       <class 'dict |       70409 |     10.01 MB
                                        <class 'str |       50323 |      7.87 MB
           <class 'django.db.models.base.ModelState |       30150 |      1.61 MB
                                        <class 'int |       51233 |      1.37 MB
                                       <class 'list |        9980 |      1.00 MB
                  <class 'memtest.models.Department |       10050 |    549.61 KB
                      <class 'memtest.models.Lesson |       10050 |    549.61 KB
                      <class 'memtest.models.Course |       10050 |    549.61 KB
                          <class 'datetime.datetime |       10050 |    471.09 KB
                                       <class 'type |           9 |     10.05 KB
                                       <class 'code |          41 |      5.97 KB
  <class 'django.utils.datastructures.ImmutableList |          28 |      2.22 KB
                                    <class 'weakref |          19 |      1.48 KB
                          <class 'method_descriptor |          12 |    864     B
                          <class 'getset_descriptor |          10 |    720     B
The memory allocated for dictionaries has significantly increased. This is logical — after all, there are many more instances of various classes now. And for each instance, there are at least 2 dictionaries - for the instance itself and for ModelState.
You can find a lot of interesting and unexpected things in memory usage which will help to make your application more compact and effective. So I strongly recommend you to play with memory-profiler and pympler from time to time.
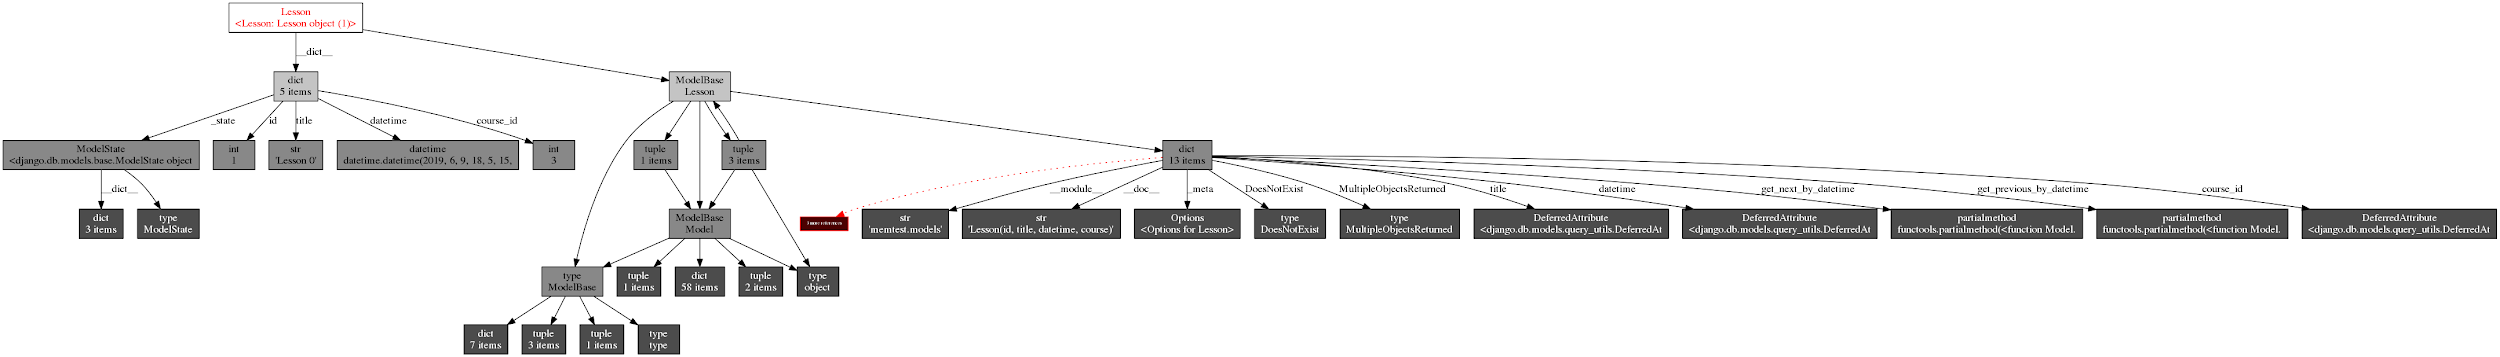
In the conclusion, here is a “small” image picture of the object graph of one Lesson instance, generated using the objgraph library =)